Web analytics (I)
Introduction to Google Analytics
")
Hello! What's going on?
In this era of technology, it is difficult to think of a web project and not include a tool that collects analytical data. The market offers multiple analytical tools and platforms, but the truth is that it is not worth investing too much time since the market has already chosen its standard.
In April 2005, Google took the lead over the other competitors in web analytics by buying Urchin Software Corp. for a hefty sum of money. This purchase is the beginning of what we know today as Google Analytics.
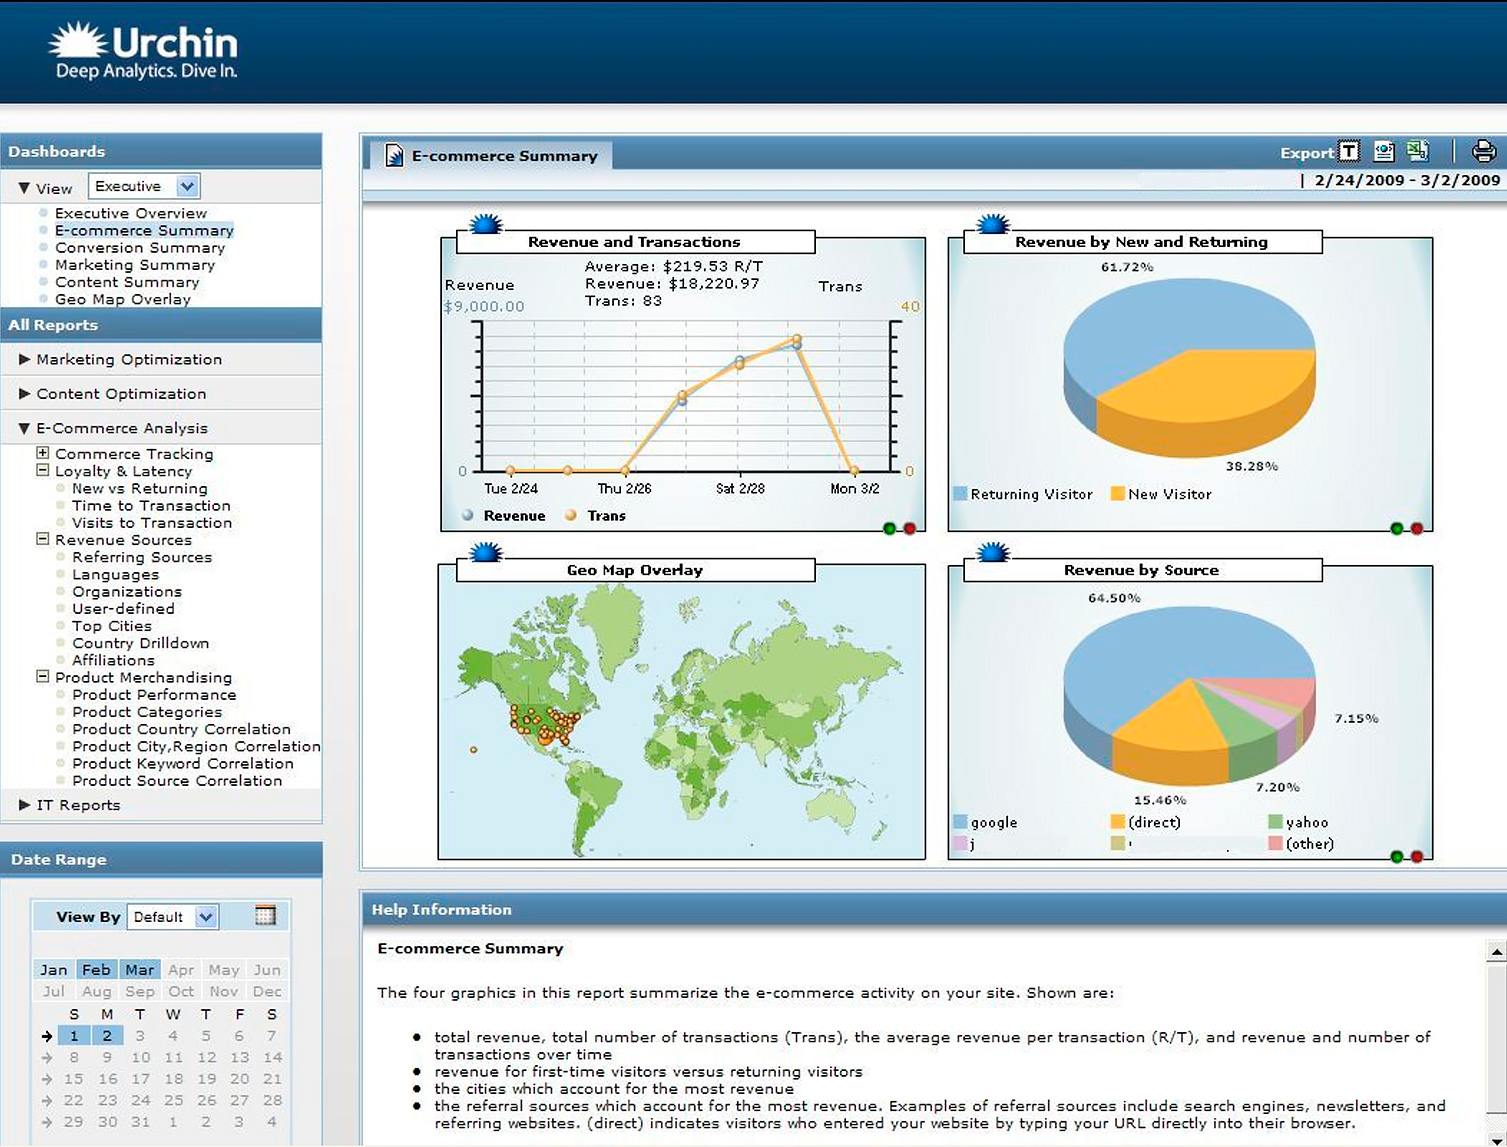
The market and the almighty Google have imposed their own standard: Google Analytics
Google Analytics has no competition due to its free, powerful, easy to use, historical ... and the most obvious reason for Google's bet is the control of Internet traffic and something even more important, the consumption data and preferences of all Internet users who browse multiple websites. Information is power and data are essential in the era of digital transformation and Google knows it very well.
At the very least, in terms of business strategy, I consider it brilliant on Google's part? Don't you think so?
And since we are talking about business strategy and specifically about web business, some questions come to my mind:
- Do you have a defined web strategy?
- Do you use analysis tools to know if the planned strategy is being followed?
- Do you have KPI (Key Performance Indicator) or key performance indicators to monitor the evolution of this strategy?
From the BAB blog, we want to contribute our bit of knowledge, in this whole world of analytics, strategies, qualitative metrics, key indicators ... and therefore we propose a series of thematic posts in which we will be writing about all these matters, which we think are of interest to you and for the optimal functioning of your business on the Internet
Having said that, let's start at the beginning with a few answers to the most common questions.
What is web analytics?
Web analytics is the procedure that collects data about the audience that visits a website, and allows a continuous analysis and thus obtain highly valuable information.
How does Google Analytics collect data?
If you have been in this sector for years, you will remember that at the end of each month you had to send the access log file of your web server to OJD (Oficina de Justificación de la Difusión). The log file is where all the traffic that travels through any web project is stored and by sending this file, the OJD colleagues obtained the traffic, audited it and then published it generating the audience ranking. Currently this procedure is obsolete, as the OJD also audits through Google Analytics.
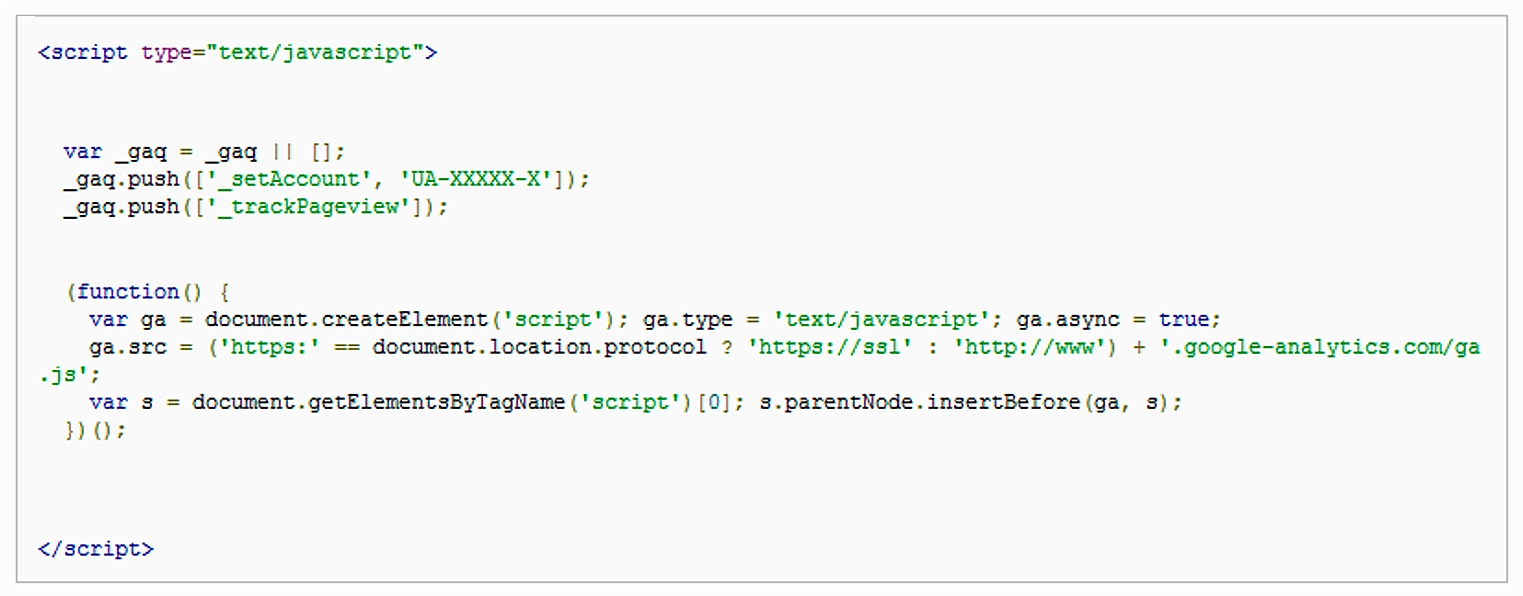
Nowadays, by creating a Google Analytics account you get the so-called "tracking code", a small piece of JavaScript code that must be included in all the pages of your project. This element is responsible for sending the traffic data generated by the users of your website to Google Analytics.
Who sends the data to Google Analytics?
The same users when they access your site through their browser.
When a user opens his Internet browser (Chrome or Firefox, Opera...) and types the Internet address or URL, a file containing HTML (HyperText Markup Language) is downloaded, which the browser interprets and then creates and visually represents the web page. Within this HTML file we insert the tracking code and it is at this point that the code is executed and the data is sent to Google Analytics. Simple and efficient.
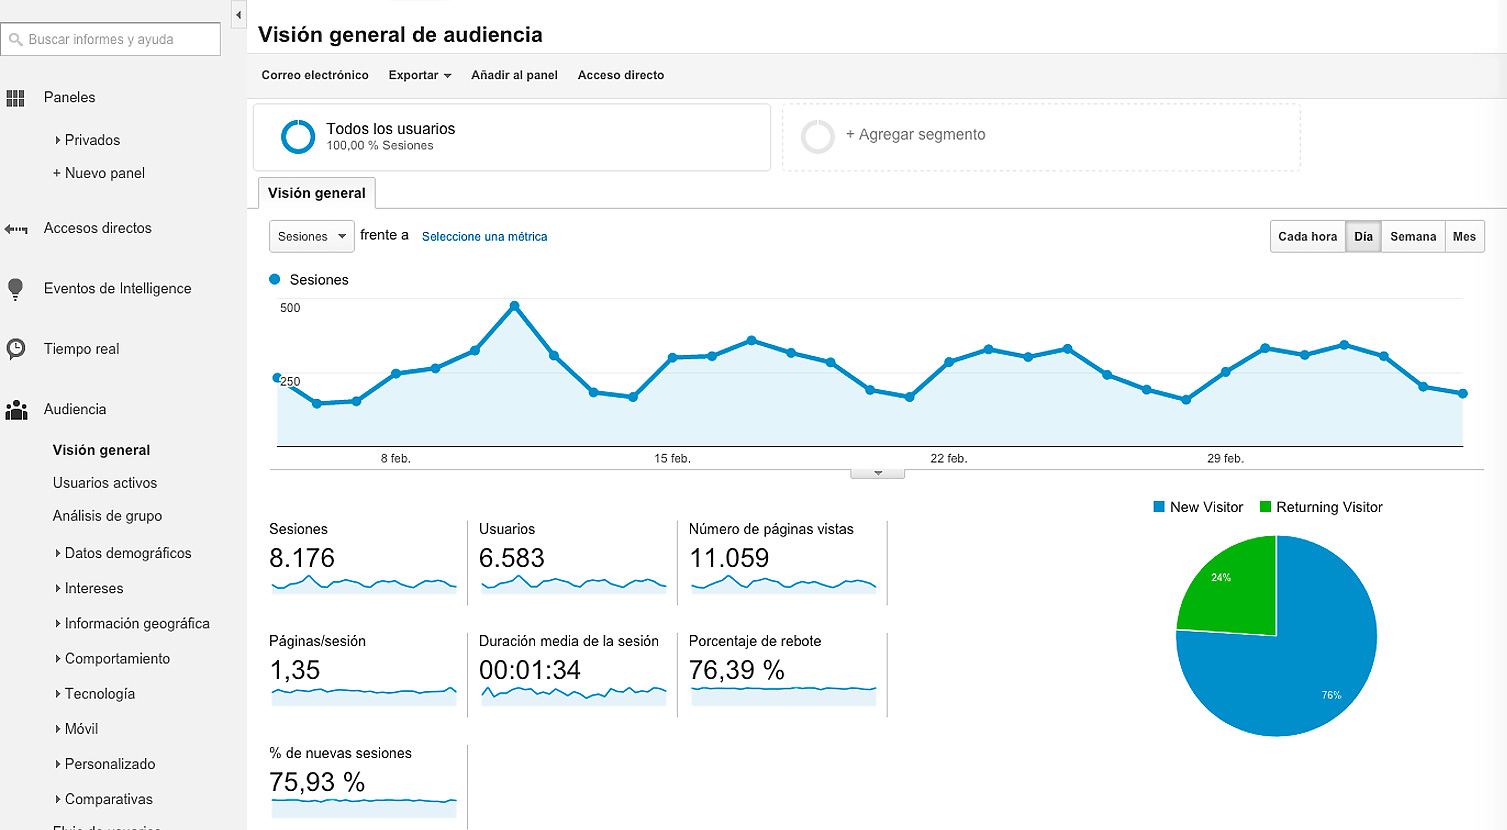
What data can we consult in Google Analytics?
If you want data about your project's audience, there are three basic variables you should take into account:
- Unique users. It's the number of real and different people accessing a web page in a specific period (usually the period is monthly). For example during the month of September a user accesses your website on 08/09, 16/09 and 30/09. These accesses are counted as 1 unique user, since they are within the same period, September.
- Visits. They represent the number of accesses made by a user in 30-minute intervals. When a user accesses a web page, a session is started and will be automatically deleted after 30 minutes as long as the user is inactive. If after 30 minutes or more, this user accesses the page again, it will generate 1 new visit. The total number of visits is usually analyzed on a monthly basis.
- Page views. Page views are all the pages downloaded in a monthly period of time. For example, a user who consults the front page, the economy section and a news item of a digital newspaper generates 3 page views.
If we talk about the behavior of the users who visit your website, three variables should be highlighted against the huge volume of atomized data provided by Google Analytics:
- Page Views / Visits. It is the ratio between the pages downloaded or consulted by a user during a visit (30 minutes). This variable gives us the average of how many pages a user views when accessing our website. An average higher than 2 is acceptable and, logically, the higher this factor is, the better we will be working and it will imply that we are able to correctly relate the contents and that we have a correct navigation, so that the users have continuity in a subject that is of interest to them and the recirculation through the web is fluid.
- Duration on the site. It is the average time that users stay on a website. Normally if the time is high, it implies that the page views / visits factor will also be high. A duration of more than 2 minutes is a correct figure.
- Bounce rate. Users who access a website and then change the address and go to another page without interacting with the first one, are counted as bounces. This behavior occurs when a user does not find what he/she is looking for or simply visits us to consume a specific content, therefore, accesses and leaves us quickly without interacting. This metric will be highly analyzed in a future post, given the importance of reducing as much as possible this percentage, which in the end is nothing more than a "sign of rejection" towards the contents of the web.
- New users. This variable provides information on the number of users who repeat their access to a web page (loyal users) and the number of users accessing for the first time.
As important as knowing the interaction of users with the content, is to know which devices the audience uses to access the content. We will obtain 3 types of data:
- Desktop. Access from desktop and laptop computers.
- Tablet. Access from iPad type tablets.
- Mobile. Access from smart phones.
Another very valuable data, is to know the acquisition channels of users to a website, ie, where they enter. Knowing the % of users coming from social networks, SEO, referral, direct... is essential for any Internet project. Depending on the project, we have 7 channel indicators:
- Organic Search. Access through search results when using search engines such as Google. This is what is known as SEO (Search Engine Optimization) traffic or search engine optimization.
- Social. Traffic obtained thanks to social networks such as Facebook, Twitter, LinkedIn...
- Direct. Direct access by users by entering the web address in the browser. This behavior corresponds to loyal users who visit a website on a recurring basis.
- Referral. These are links on third party websites that point to our website.
- E-mail. Traffic generated by sending newsletters or informative bulletins.
- Paid Search. Traffic generated by search advertising campaigns, such as Google AdWords.
- (Other). Todo el tráfico que Google Analytics no puede catalogar.
Finally, the geographic origin is an important data to take into account, because we will be able to analyze if the traffic fits with the geographic destination foreseen for our contents.
So much for the first web analytics pill. How did it go?
I'm aware that this is a lot of condensed information, even so I hope to have established a minimum knowledge base of terminology and concepts to address more important issues, as in the following post where I analyze the importance of qualitative metrics to Google Analytics, always with practical information and the intention to help in a didactic way to your editorial project.
If your editorial project needs a strategy to improve the SEO of your content, do not hesitate to contact us and we will find a solution tailored to your goals.
If you liked the content, you can share this post on social networks and 1 like will also encourage us to continue... it's free and you know that the best things in life always are.... ?
If you want to suggest a topic that adds value to the day to day of your editorial project you can do it here and if you want to subscribe to our newsletter, just leave a name and an email in the field below, and you will receive the news of our blog before anyone else.
We'll continue talking about what we like the most. Will you be there?
See you soon!
And finally, did you know...
A user who accesses your website and reads a content for 4 minutes and leaves without seeing any other page, the time computed by Google Analytics is 0. But don't worry, it does compute as a user...